

Predicting deprivation and health outcomes from grocery shopping and its nutritional content
What are the most important transactional metrics that can be used to predict deprivation and childhood obesity?
This project investigates whether the use of large scale digital footprint data, in the form of loyalty card grocery sales from a large UK food retailer, can be used to predict deprivation and health outcomes at the neighbourhood scale. Additionally, if this is possible, what are the most important transactional metrics that can be used to predict deprivation and obesity?
The nutritional content of food products was linked to the transactional data and combined with metrics on shopping behaviours (e.g. products per basket, number of customers, etc.) and food categories (e.g. fruit and vegetables, red meat, dairy, etc.) to generate a set of features to be used to predict deprivation/obesity. Data was assigned to the neighbourhood scale using anonymised customer geo-location provided by the project partner.
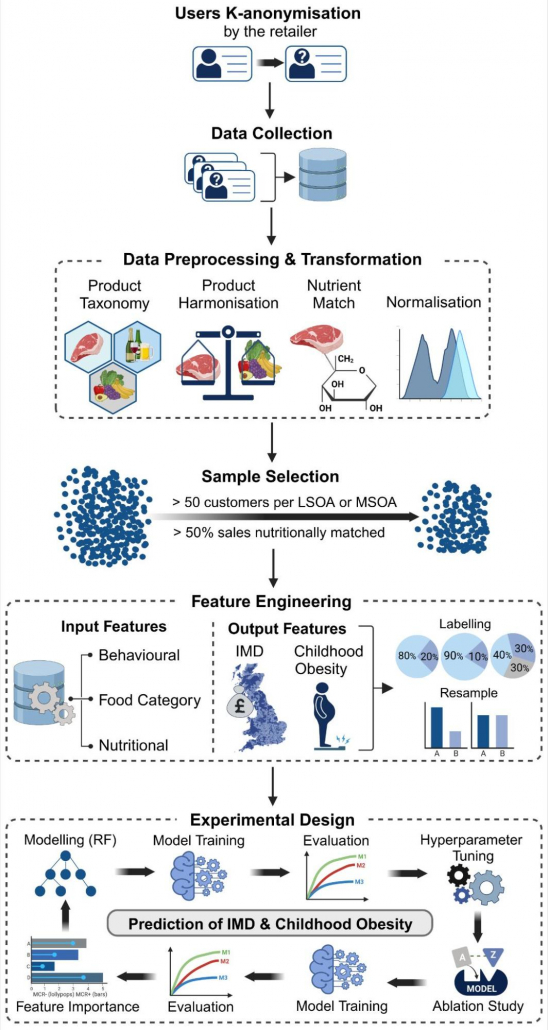
Grocery data for over 4 million Co-op Food members (loyalty card holders) covering a 20 month period from 2019 to 2021 was collected and processed according to the workflow shown below. Grocery sales were assigned to small areas, Lower layer Super Output Areas (LSOAs) and Middle layer Super Output Areas (MSOAs), and its nutritional content was assigned using a nutritional mapping exercise.
Machine Learning classifiers were used to predict areas with high levels of overall deprivation or childhood obesity. A range of binary and ternary classifiers were developed, as shown in the workflow diagram, in order to identify the optimal method for identifying high levels of deprivation/obesity.
Features relating to shopping behaviours, food categories, its associated nutritional content and nutritionally derived metrics were assessed for their importance in classification.
Initial findings show that areas of extreme deprivation and child obesity can be classified with high levels of accuracy (~80%).
In terms of deprivation, higher levels of spending on ready made foods, fish, wine and fruit and vegetables is associated with areas of least deprivation in both models. In comparison, areas with higher sales volumes of soft drinks and cigarettes are associated with higher levels of deprivation. In terms of our nutritionally derived metrics, Calorie-Oriented Purchasing (COP), i.e. Number of calories per pound spent, demonstrated high importance in predicting deprivation. High values of COP are associated with areas with the highest levels of deprivation. Indicating, as expected, that shoppers in deprived areas are getting more calories for every pound spent.
For childhood obesity, the quantity of soft drinks sold and COP were the most important features. High levels of both features were found to be prevalent in areas of higher childhood obesity. The quantity of fruit and vegetables and fish sold were also found to be significant predictors of childhood obesity with areas with higher sales of these products showing lower levels of childhood obesity.
Predicting health related deprivation using loyalty card digital footprints
In England, The Indices of Deprivation (IoD) are a widely used and referenced measure to assess local levels of deprivation across a range of domains, including health and disability. However, due to their complex nature and the number of inputs required to generate these measures, they are only updated infrequently…[more]

