

Privacy-preserving & machine-learned catchment models for spatial attribution of big data
Utilising anonymised geo-location data on co-op food members, we have developed machine learning models to predict the extent of catchment areas for stores that can be used to spatially attribute sales transactions for non-member data.
The accurate geo-location of digital footprint data is often a critical element in developing machine learning tools. When working with neighbourhood level datasets such as census data, deprivation statistics or other key demographic data it is essential that our digital footprint data is accurately mapped to each neighbourhood. Inaccurate spatial attribution will greatly reduce our models predictive and analytic capability.
Conversely, maintaining the privacy of customer’s personal data and ensuring their identity is not compromised is essential to maintaining public and commercial support for the sharing of such data for research. Balancing these two diametrically opposed concepts is the aim of this work.
Utilising anonymised geo-location data on co-op food members, we have developed machine learning models to predict the extent of catchment areas for stores that can be used to spatially attribute sales transactions for non-member data. This offers the potential to greatly increase the representativeness of sales by removing the biases associated with depending solely on loyalty card data.
Transactional data covering a large UK food retail network (over 2000 stores) over a 20 month period was linked to anonymised geo-locations, at the Lower layer Super Output Area (LSOA) scale, for over 4 million Co-op Food members. Shopping trip distances were calculated for each transaction, based on LSOA population weighted centroids and store locations provided by the retailer. The median, 80th percentile and 95th percentile of shopping trips for each store were calculated and used as the dependent variable to train a range of machine learning models, including linear regression, support vector, random forest and XGBoost.
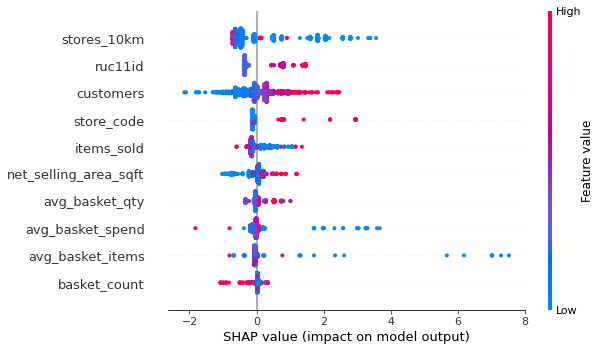
Predictor variables included features extracted from the digital footprint data such as store type, no. of customers, sales levels, average basket spend and quantity. Additional variables relating to the store were also collated such as the number of other food retailers within 10km of the store and the rural/urban classification of the store’s location. Predictor feature importance was analysed using SHAPley values.
The best performing ML models developed are capable of achieving an out of sample accuracy around 70% (R2 = 0.72) with a Mean Squared Error of 1.06km when predicting the 80th percentile of shopping trip distances for a store. The tree-based models (Random Forest and XGBoost) were found to provide significantly higher accuracy than the linear and support vector-based regression models.
SHAP analysis found the number of food retailers in the locality of each co-op and the rural/urban classification of the store’s location to be the most important features, as shown in the SHAP summary chart below.
These results enables us to provide bespoke catchment radii for each store in the retail network and is a significant improvement over standard approaches that would typically use a fixed radius catchment for each store or a variable radius based on a limited set of store–based features (e.g. store type, location, sales area). It could be used to spatially attribute the non-member sales data which represents around 70% of total sales and would therefore greatly increase the representativeness of the data by reducing the biases associated with working solely with loyalty card transactions.
Predicting health related deprivation using loyalty card digital footprints
In England, The Indices of Deprivation (IoD) are a widely used and referenced measure to assess local levels of deprivation across a range of domains, including health and disability. However, due to their complex nature and the number of inputs required to generate these measures, they are only updated infrequently…[more]

