

Predicting Alcohol-Related Mortality Using Supermarket Behavioural Data
Can what people put in their shopping basket tell us which communities are most at risk from alcohol-related death? We find strong evidence that it can and that retail transaction data captures consumption patterns that traditional demographic indicators miss.
Alcohol-specific mortality reached 8,276 deaths in England in 2023, a figure that has dramatically increased. The behavioural drivers of these deaths remain difficult to measure using traditional survey methods, which are vulnerable to stigma and under-reporting bias. This project integrates anonymised supermarket transaction data from a UK retailer with established socioeconomic predictors to model spatial inequalities in alcohol mortality across English Lower-tier Local Authorities (LTLAs). Using machine learning with rigorous spatial cross-validation, we test whether shopping behaviours improve prediction beyond standard demographics.
All individual-level transaction data were aggregated to LTLA level (292 districts, 92% coverage of England). Literature informed and exploratory feature engineering generated 93 shopping-derived variables, covering alcohol units, basket composition, beverage type, temporal patterns, and spatial lags, alongside 32 demographic and deprivation features drawn from the English Indices of Deprivation 2019 and ONS mid-year estimates.
A two-stage feature selection process (correlation filtering followed by Recursive Feature Elimination across spatial folds) reduced 125 candidates to a final set of 28 features: 13 demographic and 15 shopping-derived. Multiple regression and ensemble algorithms were evaluated via grid search, including CatBoost, XGBoost, Random Forest, Lasso, Ridge, and Elastic Net.
To address significant spatial autocorrelation in alcohol mortality (Moran’s I = 0.51), we implemented a rotated spatially stratified 5-fold cross-validation scheme. Each fold captures representative spatial cluster structures, preventing geographic leakage and ensuring performance estimates reflect true generalisability rather than proximity-driven overfitting.
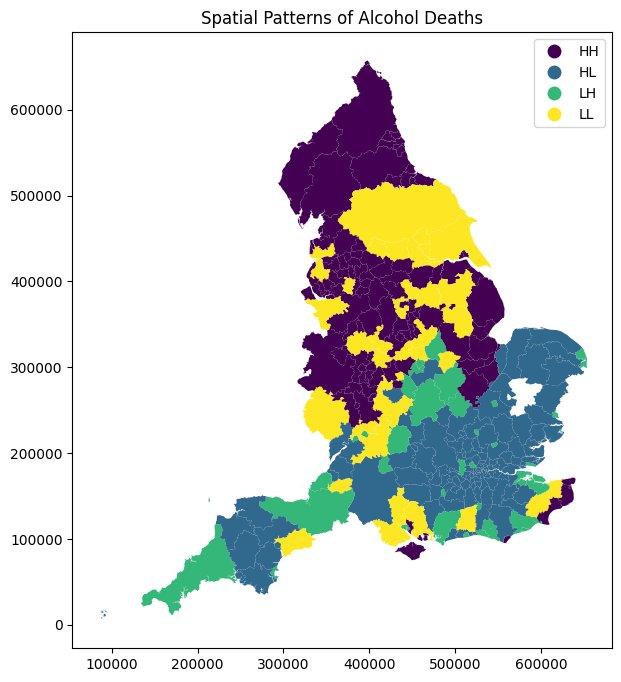
Figure 1. LISA spatial cluster map of alcohol-specific deaths across English Local Authorities (Moran’s I = 0.51, p < 0.001).
CatBoost emerged as the best-performing algorithm across all non-random feature sets. A refined 15-feature model combining the strongest demographic and retail signals achieved R² = 0.374 (±0.102), outperforming both the full 28-feature combined model (R² = 0.323) and the demographic-only baseline (R² = 0.347), demonstrating that careful feature selection from novel data sources yields more parsimonious and generalisable predictions.
Bayesian bootstrap analysis (10,000 resamples, ROPE ±0.01 R²) confirmed practical superiority: 98.1% of bootstrap samples exceeded the equivalence threshold when comparing the refined model to the full feature set, with zero samples showing meaningful deterioration. Three of the five most important SHAP features derive from retail transaction data:
Spirits purchasing intensity (quadratic) captures accelerating harm at high consumption levels
Store-level alcohol basket concentration: a dynamic retail-environment metric beyond static outlet counts
Spatial consumption lag operationalises social spillover effects in neighbouring purchasing behaviour
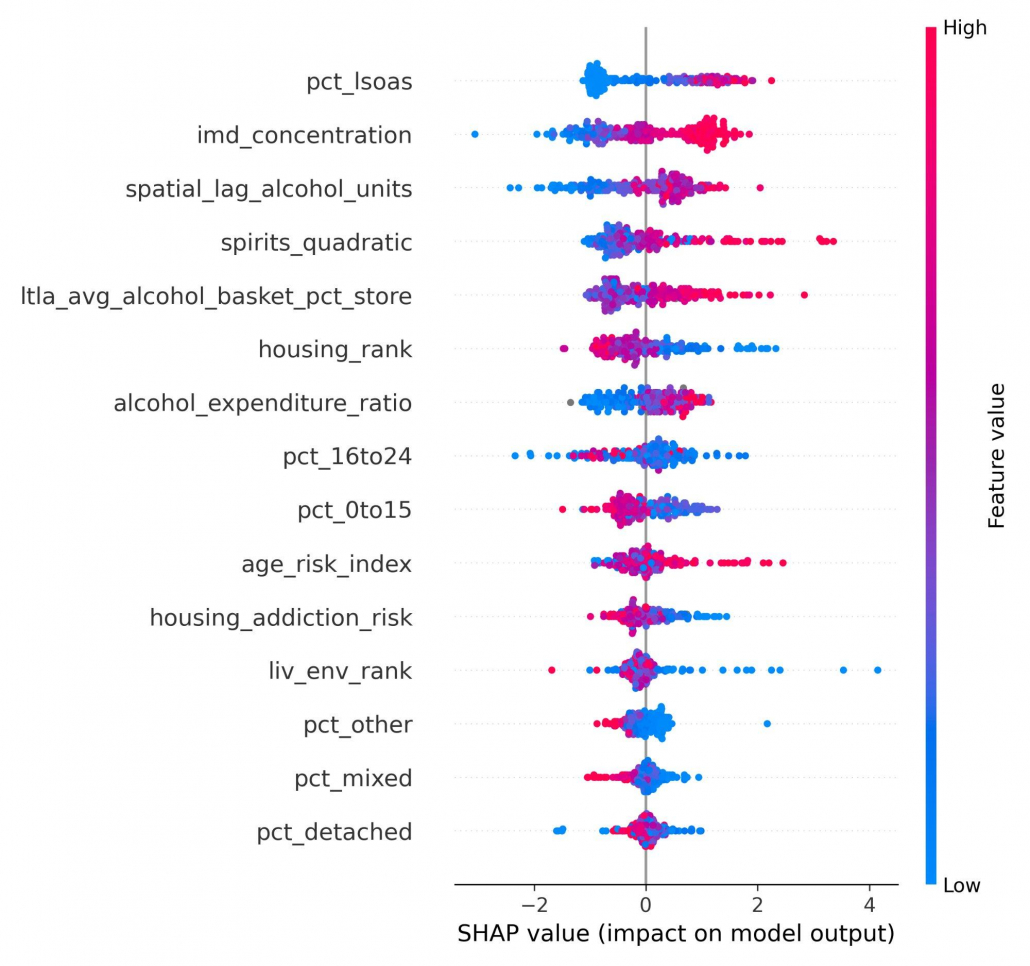
Figure 2. SHAP summary plot showing feature importance in the refined CatBoost model. Features ranked by mean absolute SHAP value; colour indicates feature value (red = high, blue = low).
Modelling alcohol mortality via machine learning and retail behavioural data.
Integrating supermarket behavioural data with established indicators to improve alcohol-related mortality prediction in England.
Within behavioural sciences, there has been a resurgence in not only explaining factors but also predicting them with precision that exceeds classic social science standards. In England (UK), alcohol is a ubiquitously used substance with cultural significance but also many potential issues related to … [more]

